The 7-hills running race (7-heuvelenloop) is a yearly running race in and around Nijmegen. The main event is a race of 15 kilometers long. I ran it myself a couple of times, but not in last year. On to animating the race. Using the following packages:
library(tidyverse)
library(zoo)
library(readxl)
library(lubridate)
library(magrittr)
library(gganimate)
library(ggmap)
library(ggrepel)
I took data of 5 runners from the website with the results and times each kilometer. These are the times of the winner, the slowest finisher and three runners in between.
##times from the 2017 race: https://www.nnzevenheuvelenloop.nl/deelnemers/zevenheuvelenloop/uitslagen/ (in dutch)
times <- data.frame(runners = rep(1:5, each = 15),
                    km = rep(1:15, 5),
                    time = rep(c("00:02:37", "00:05:27",	"00:08:19",	"00:11:07",	"00:13:58",	"00:16:46",	"00:19:27",	"00:22:22",
                                 "00:25:11", "00:27:46",	"00:30:37",	"00:33:24",	"00:36:02",	"00:38:39",	"00:41:16",
                                 "00:05:41", "00:11:27",	"00:17:22",	"00:23:08",	"00:29:01",	"00:34:53",	"00:40:30",	"00:46:21",
                                 "00:52:05", "00:57:37",	"01:03:44",	"01:09:32",	"01:15:02",	"01:20:39",	"01:26:03",
                                 "00:05:01", "00:09:59",	"00:15:12",	"00:20:24",	"00:25:55",	"00:31:16",	"00:36:29",	"00:42:08",
                                 "00:47:34", "00:52:41",	"00:58:21",	"01:03:53",	"01:09:01",	"01:14:14",	"01:19:24",
                                 "00:08:57", "00:18:21",	"00:27:31",	"00:39:57",	"00:48:44",	"00:57:58",	"01:13:31",	"01:23:03",
                                 "01:32:01", "01:43:34",	"01:52:10",	"02:01:01",	"02:09:31",	"02:18:24",	"02:27:07",
                                 "00:04:02", "00:07:55",	"00:11:53",	"00:15:55",	"00:20:07",	"00:24:11",	"00:28:06",	"00:32:22",
                                 "00:36:30", "00:40:17",	"00:44:29",	"00:48:33",	"00:52:21",	"00:56:10",	"00:59:59")))
The route was already available for downloading (https://www.gpscoordinaten.nl/route-track-detail.php?id=27527 , dutch). Prepared for analysis with Qgis.
## route coordinates: https://www.gpscoordinaten.nl/route-track-detail.php?id=27527 downloaded and prepared with Qgis
route <- read.csv2("zevenheuvelenpointsm.csv", stringsAsFactors = FALSE)
## coordinate points are equally spaced from eachother divided over the 15 km. Adding distance to the coordinates in meters...
route <- route %>%
  mutate(x = 15000/(nrow(route)-1),
         meter = cumsum(x)-x) %>%
  select(X, Y, meter)

## ...in kilometers
route$km <- NA

for (i in seq(0, 15000, by = 1000)) {
  route$km[which(abs(route$meter-i) == min(abs(route$meter-i)))] <- i / 1000
}
With the data of the path of the race and running times it’s a matter of joining them. I used two joins to avoid the ‘cannot allocate vector of size..’ error when using the full join on both complete data sets. The points are equal distances from each other. So it’s pretty easy to calculate the times the runners pass each point on the route.
route_times <- times %>%
  ## joining meters of the route to running times
  full_join(route %>% select(meter, km), by = "km") %>%
  ## getting meters along the route for every runner
  complete(runners, meter) %>%
  ## joining remaining route data
  left_join(route %>% select(-km), by = "meter") %>%
  mutate(km = if_else(meter == 0 , 1, km),
         time = if_else(meter == 0 , "00:00:00", as.character(time))) %>%
  filter(!is.na(runners)) %>%
  ## fill in amount of seconds run so far for each point on the route.
  group_by(runners) %>%
  mutate(sec = na.approx(period_to_seconds(hms(time)))) %>%
  fill(km, .direction = "up") %>%
  ungroup() %>%
  mutate(X = as.numeric(as.character(X)),
         Y = as.numeric(as.character(Y)))
Making some labels for the animation later. calculating the avarage speed for each runner in each section and adding their finish times.
## calculate avarage speed each km for labeling
avg_speed <- route_times %>%
  group_by(runners, km) %>%
  summarise(sec_tot_prev = max(sec)) %>%
  mutate(km = km + 1) %>%
  right_join(route_times %>% group_by(runners, km) %>%
               summarise(sec_tot_km = max(sec)),
             by = c("runners", "km")) %>%
  mutate(avg_speed = if_else(km == 1, round(3600 / sec_tot_km, 1),
                             round(3600 / (sec_tot_km - sec_tot_prev), 1))) %>%
  select(runners, km, avg_speed)


## finishtime for labeling
finish_time <- route_times %>%
  group_by(runners) %>%
  filter(meter == max(meter)) %>%
  mutate(finishtime = time) %>%
  select(runners, finishtime)
To make the data set smaller and a bit easier to animate we take each 15 seconds of the race.
## calculate the closes position of the runner every 15 seconds. So runners progress in
## even timeframes for easier animations

route_times <-  route_times %>%
  mutate(sec15 = ceiling(sec / 15) * 15)
Get the data for each runner every 15 seconds of the race. Also adding the labels back to the dataset.
## select the point where the runners are each 15 seconds
route_times_15sec <- route_times %>%
  group_by(sec15, runners) %>%
  summarise_all(.funs = first) %>%
  ## add the labels
  left_join(avg_speed, by = c("runners", "km")) %>%
  left_join(finish_time, by = "runners") %>%
  ungroup() %>%
  mutate(label_t = paste0(finishtime, " -- ", avg_speed, " km/h"),
         label_time = seconds_to_period(sec15),
         label_time = paste0("race time: ", label_time)) %>%
  select(-time)
Getting the background map through get_map. This needs a registered google static map API. You can get one yourself here: https://cloud.google.com/maps-platform/. The map is centered at the mean of the coordinates of the route.
## get mean coordinates for the centre of the plot

lat <- mean(c(max(route_times$Y), min(route_times$Y)))
long <- mean(c(max(route_times$X), min(route_times$X)))

## register_google(key = "key")
## get the background map
m <- get_map(c(long, lat), zoom = 13,
             source = "stamen",
             maptype = "toner")
Making the plot. Using ggrepel to have labels that behave nicely in the animation. When you’re making bigger sized animations it is sometimes good to restrict the area where these labels can be. Otherwise they might appear ‘jittery’. There are just 2 (!) gganimate options to make the animations.
p <- ggmap(m) +
  scale_x_continuous(limits = c(min(route_times$X), max(route_times$X)), expand = c(0.0015, 0.0015)) +
  scale_y_continuous(limits = c(min(route_times$Y), max(route_times$Y)), expand = c(0.0015, 0.0015)) +
  geom_point(data = route_times_15sec, aes(x = X, y = Y,
                                          color = as.factor(runners)), size = 5)+
  geom_label_repel(data = route_times_15sec,
                   aes(x = X, y = Y,
                       fill = as.factor(runners),
                       label = label_t),
                   size = 4, fontface = "bold",
                   ## padding to keep the labels from covering the points
                   box.padding = 0.35, point.padding = 1,
                   ## without the nudging the labels are more jittery
                   nudge_y = 0.0025, nudge_x = 0.02) +
  ## couldnt get the title to work so added a label layer with the racetime
  geom_label(data = route_times_15sec %>% filter(runners == 4),
             aes(x =  5.867, y = 51.79665,label = label_time),
             size = 4.5, color = "black", fill = " white", fontface = "bold", hjust = "left") +
  theme_void() +
  theme(legend.position = "none") +
  ## gganimate options
  transition_reveal(runners, sec15) +
  ease_aes("linear")

animate(p, nframes = 500, width = 600, height = 600)
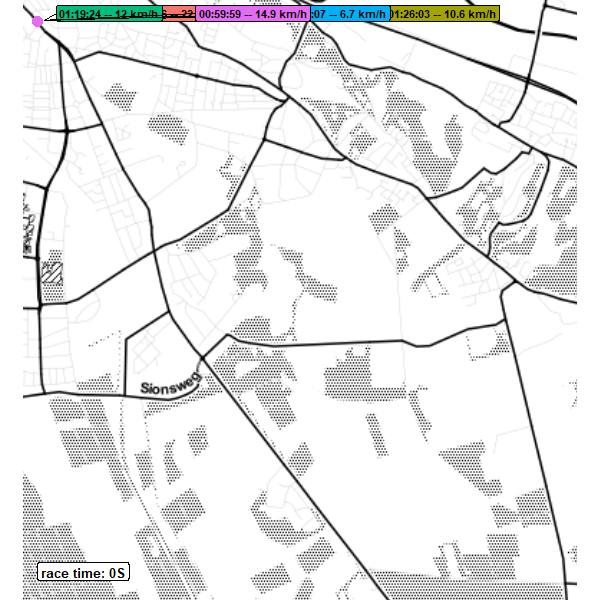
The speed difference between the fastest and slowest runner is really something! But even the difference between the winner and someone running at 15 km/ hour is clearly visible. 2018-11-18 will be this years race, same route.
I made this animation almost a year ago. With the older gganimate syntax i managed to combine geom_point and geom_path in one animation and have the runners leave a trace as they run. I couldn’t find a way to do that now. Anyone know how to do that?
I have at least one more animating project left to write about. See you then!